How to Send MuleSoft Logs to Splunk: A Complete Guide


Integrating MuleSoft logs with Splunk enables seamless data management and robust analytics. By forwarding logs to Splunk, organizations gain real-time insights into system performance and error trends, enhancing operational efficiency and strengthening security measures.

In this guide, I will walk you through a step-by-step guide to sending MuleSoft logs to Splunk using Log4j2.

What is Splunk?

Splunk is a software platform for searching, analyzing, and visualizing large volumes of data in real-time. It helps organizations gain insights from their data by collecting, indexing, and correlating information from various sources like logs, events, and metrics.

Essentially, it’s like a powerful search engine for your data, allowing users to monitor, troubleshoot, and make informed decisions based on the information they gather.

What is Log4j2?

Log4j2 is a Java-based logging framework developers use to record information about the execution of their programs. It allows developers to easily manage and customize their applications’ logging behaviour, such as specifying which events to log, where to store the log data, and in what format.

Log4j2 helps debug, monitor, and analyze Java-based application performance by providing a flexible and efficient logging solution.

Send MuleSoft Logs to Splunk

Let’s start by understanding the problem statement and how we can use log4j2.xml to push MuleSoft application logs to Splunk.

To make it easier to follow, we’ve laid out a trail of croissants to guide your way. Whenever you see a 🥐 it means there’s something for you to do.

Prerequisites

Before you begin, ensure you have the following:

  • Basic understanding of Log4j2, Splunk and Mule 4
  • Splunk Cloud trial account or Splunk docker instance
  • Anypoint Studio is installed on your machine

Problem Statement

  1. CloudHub application logs are restricted to 30 days or 100MB, whichever comes first, which poses challenges in effective management and analysis.
  2. This limitation risks losing valuable log data beyond the retention period, making troubleshooting past issues difficult.
  3. Inefficient log management practices may impact compliance and application reliability.
  4. A robust log management solution is critical to optimizing retention, facilitating efficient analysis, ensuring compliance, and maximizing the value derived from log data.

MuleSoft Application Configuration

Follow the below steps to configure Log4j2.xml to push MuleSoft logs to Splunk.

There are different methods for dealing with log forwarding to Splunk. However, in this guide, we use the Splunk Appender method.

1. Add Splunk Appender in Log4j2.xml

🥐 Navigate to src/main/resources and open log4j2.xml file.

🥐 Add the packages for com.splunk.logging and org.apache.logging.log4j in your log4j2.xml’s Configuration tag.

<Configuration status="INFO" packages="com.splunk.logging, org.apache.logging.log4j">

🥐 Add Splunk Appender inside <Appenders> section.

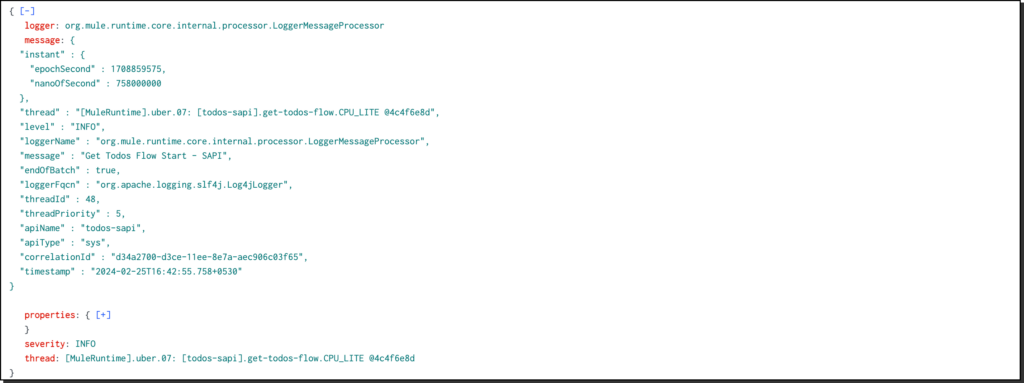
Here, you can customize the logs in different ways. For instance, you can log in just like MuleSoft logs on CloudHub, or you can use JSONLayout to log extra information just like JSON Logger.

CloudHub Pattern

cloudhub-logs-pattern

Appender Configuration

<SplunkHttp name="Splunk" url="https://<splunk-url>:<port>" 
   token="<token>" 
   index="<index>" 
   disableCertificateValidation="true" 
   batch_size_count="10">
   <PatternLayout pattern="%-5p %d [%t] [processor: %X{processorPath}; event: %X{correlationId}] %c: %m%n"/>
</SplunkHttp>

JSONLayout Pattern

json-layout-pattern

Appender Configuration

<SplunkHttp name="splunk" 
   url="https://<splunk-url>:<port>"
   token="<token>"
   index="<index>" 
   disableCertificateValidation="true">
   <JSONLayout complete="false" compact="false">
      <KeyValuePair key="apiName" value="<app.name>"/>
      <KeyValuePair key="apiType" value="<api.type>"/>
      <KeyValuePair key="correlationId" value="$${ctx:correlationId:-}"/>
      <KeyValuePair key="timestamp" value="$${date:yyyy-MM-dd'T'HH:mm:ss.SSSZZ}"/>
   </JSONLayout>
</SplunkHttp>

JSONLayout formats log events into JSON (JavaScript Object Notation) format. This format is handy for structured logging because it organizes log data into key-value pairs, making it easier for various log management and monitoring tools to parse and analyze.

You can add as many as KeyValuePairs.

🥐 Add AppenderRef inside Loggers/AsyncRoot tag section

<AppenderRef ref="Splunk"/>

The name of the Appender and AppenderRef should be the same.

2. Add Splunk Dependencies and Repository

🥐 Open pom.xml and add the below dependencies and repository.

Dependencies

<dependency>
   <groupId>com.splunk.logging</groupId>
   <artifactId>splunk-library-javalogging</artifactId>
   <version>1.7.3</version>
</dependency>
<dependency>
   <groupId>org.apache.logging.log4j</groupId>
   <artifactId>log4j-core</artifactId>
   <version>2.10.0</version>
</dependency>
<dependency>
   <groupId>org.apache.logging.log4j</groupId>
   <artifactId>log4j-api</artifactId>
   <version>2.10.0</version>
</dependency>

Repository

<repository>
   <id>splunk-artifactory</id>
    <name>Splunk Releases</name>
   <url>https://splunk.jfrog.io/splunk/ext-releases-local</url>
</repository>

Deployment

Now deploy your Mule application on CloudHub. Make sure to disable CloudHub logging by checking the Disable CloudHub logs option.

This will altogether disable CloudHub logging, and you must include the appenders in your custom configurations in the log4j2.xml file to enable MuleSoft Support team visibility into the logs.

To send log data to CloudHub, add the below Appender in your log4j2.xml file.

<Log4J2CloudhubLogAppender name="CLOUDHUB"
    addressProvider="com.mulesoft.ch.logging.DefaultAggregatorAddressProvider"
    applicationContext="com.mulesoft.ch.logging.DefaultApplicationContext"
    appendRetryIntervalMs="${sys:logging.appendRetryInterval}"
    appendMaxAttempts="${sys:logging.appendMaxAttempts}"
    batchSendIntervalMs="${sys:logging.batchSendInterval}"
    batchMaxRecords="${sys:logging.batchMaxRecords}"
    memBufferMaxSize="${sys:logging.memBufferMaxSize}"
    journalMaxWriteBatchSize="${sys:logging.journalMaxBatchSize}"
    journalMaxFileSize="${sys:logging.journalMaxFileSize}"
    clientMaxPacketSize="${sys:logging.clientMaxPacketSize}"
    clientConnectTimeoutMs="${sys:logging.clientConnectTimeout}"
    clientSocketTimeoutMs="${sys:logging.clientSocketTimeout}"
    serverAddressPollIntervalMs="${sys:logging.serverAddressPollInterval}"
    serverHeartbeatSendIntervalMs="${sys:logging.serverHeartbeatSendIntervalMs}"
    statisticsPrintIntervalMs="${sys:logging.statisticsPrintIntervalMs}">
    <PatternLayout pattern="[%d{MM-dd HH:mm:ss}] %-5p %c{1} [%t]: %m%n"/>
</Log4J2CloudhubLogAppender>
<AppenderRef ref="CLOUDHUB"/>

Here is the complete log4j2.xml, along with the CloudHub appender configuration.

<?xml version="1.0" encoding="utf-8"?>
<Configuration status="INFO" name="cloudhub" packages="com.mulesoft.ch.logging.appender, com.splunk.logging, org.apache.logging.log4j">
    <Appenders>
        <RollingFile name="file" fileName="${sys:mule.home}${sys:file.separator}logs${sys:file.separator}hello-world.log"
            filePattern="${sys:mule.home}${sys:file.separator}logs${sys:file.separator}hello-world-%i.log">
            <PatternLayout pattern="%-5p %d [%t] [processor: %X{processorPath}; event: %X{correlationId}] %c: %m%n"/>
            <SizeBasedTriggeringPolicy size="10 MB"/>
            <DefaultRolloverStrategy max="10"/>
        </RollingFile>
        <!-- Splunk Log4j2 Configuration -->
        <SplunkHttp name="Splunk" 
            url="https://{{splunk-url}}:{{port}}/" 
            token="{{token}}" 
            index="{{index}}"
            disableCertificateValidation="true" 
            batch_size_count="10">
            <JSONLayout complete="false" compact="false">
                <KeyValuePair key="apiName" value="hello-world"/>
                <KeyValuePair key="appName" value="Hello World API"/>
                <KeyValuePair key="apiType" value="exp"/>
                <KeyValuePair key="correlationId" value="$${ctx:correlationId:-}"/>
                <KeyValuePair key="timestamp" value="$${date:yyyy-MM-dd'T'HH:mm:ss.SSSZZ}"/>
            </JSONLayout>
        </SplunkHttp>
        <!--CloudHub Custom Log4j2 Configuration -->
        <Log4J2CloudhubLogAppender name="CloudHub"
            addressProvider="com.mulesoft.ch.logging.DefaultAggregatorAddressProvider"
            applicationContext="com.mulesoft.ch.logging.DefaultApplicationContext" appendRetryIntervalMs="${sys:logging.appendRetryInterval}"
            appendMaxAttempts="${sys:logging.appendMaxAttempts}" batchSendIntervalMs="${sys:logging.batchSendInterval}"
            batchMaxRecords="${sys:logging.batchMaxRecords}" memBufferMaxSize="${sys:logging.memBufferMaxSize}"
            journalMaxWriteBatchSize="${sys:logging.journalMaxBatchSize}" journalMaxFileSize="${sys:logging.journalMaxFileSize}"
            clientMaxPacketSize="${sys:logging.clientMaxPacketSize}" clientConnectTimeoutMs="${sys:logging.clientConnectTimeout}"
            clientSocketTimeoutMs="${sys:logging.clientSocketTimeout}" serverAddressPollIntervalMs="${sys:logging.serverAddressPollInterval}"
            serverHeartbeatSendIntervalMs="${sys:logging.serverHeartbeatSendIntervalMs}"
            statisticsPrintIntervalMs="${sys:logging.statisticsPrintIntervalMs}">
            <PatternLayout pattern="[%d{MM-dd HH:mm:ss}] %-5p %c{1} [%t]: %m%n"/>
        </Log4J2CloudhubLogAppender>
    </Appenders>
    <Loggers>
        <AsyncLogger name="org.mule.service.http" level="WARN"/>
        <AsyncLogger name="org.mule.extension.http" level="WARN"/>
        <AsyncLogger name="org.mule.runtime.core.internal.processor.LoggerMessageProcessor" level="INFO"/>
        <AsyncRoot level="INFO">
            <AppenderRef ref="file"/>
            <AppenderRef ref="Splunk"/>
            <AppenderRef ref="CloudHub"/>
        </AsyncRoot>
    </Loggers>
</Configuration>

Analyse Logs in Splunk

🥐 Login to your Splunk Cloud account and navigate to Apps -> Search and Reporting.

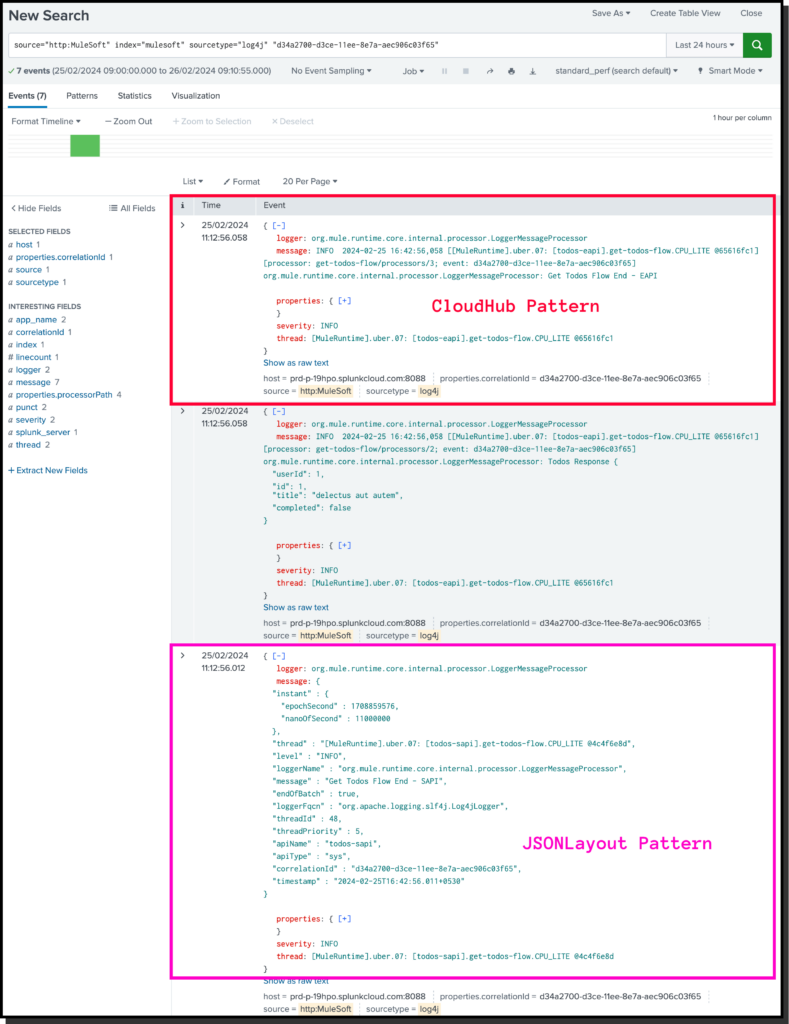
I have used the CloudHub pattern in one application and JSONLayout in another. Let’s see how the logs will be printed in Splunk.

🥐 Enter the following command in the search bar.

source="http:MuleSoft" index="mulesoft" sourcetype="log4j" "d34a2700-d3ce-11ee-8e7a-aec906c03f65"

Make sure to change the values as per your configuration. You can check with your Splunk Admin for source, index, and sourceType values.

Otherwise, if you want to learn how to create Data inputs and indexes, let me know in the comment section.

The search result?
Conclusion

In this guide, we’ve uncovered how to seamlessly push MuleSoft logs to Splunk using Log4j2. Following these steps, you can centralize log management and gain valuable insights into your applications’ performance.

We encourage you to comment with any queries or suggestions regarding this guide. Your feedback is invaluable in refining and improving the process for our readers.

For more MuleSoft guides, news and tutorials, visit our dedicated MuleSoft DevGuides portal.

1 COMMENT

Subscribe
Notify of
guest
1 Comment
Oldest
Newest Most Voted
Inline Feedbacks
View all comments
srinivas
srinivas
3 months ago

please have have one article on how to create Data inputs and indexes in splunk for the above one

Similar Guides.

The Ultimate Guide to Async Scope in Mule 4

This is an absolute beginner's guide to Async Scope...

Implementing Parent POM in Mule 4: A Complete Guide

Parent POM (Project Object Model) plays a crucial role...
1
0
Would love your thoughts, please comment.x
()
x